The sample consists of American Initial Public Offerings underpriced in the first day
of trading for 2006 and 2007. The years 2008 and 2009 have not been included in the sample
due to lack of available information. The data base includes 348 offerings, after excluding the
issues having an underpricing less than 5%, the sample is reduced to 225 IPOs, and I require
the firms to be available in the U.S Securities and Exchange Commission website because I
use the SEC database for the company filings and prospectuses which further reduce the
sample to 217 IPOs.
My primary data source for the IPOs is http://www.iposcoop.com database. I have collected
the missing information from prospectuses available in the SEC’s Electronic Data Gathering
and Retrieval (EDGAR) system for IPOs (final prospectuses are identified on EDGAR as
document 424B at http://www.sec.gov), and from a number of other sources.
Underwriter rankings are on a 0 to 9 scale. Information comes from the Jay Ritter website, a
file presenting the rankings of all underwriters from 1980-2007. All the rankings in this file
are integers followed by a 0.1 (1.1 up to 9.1). Loughran and Ritter attach a 0.1 to all rankings
so that other researchers can easily distinguish between their rankings and those from Carter
and Manaster and Carter, Dark, and Singh, which never end with a 0.1. Because Loughran
and Ritter to make this underwriter rankings’ file start with the Carter and Manaster (1990)
and Carter et al. (1998) rankings, but with some changes, and they make their own
methodology to complete rankings for the other years.
To measure the Overhang Ratio, Pre-IPO shares retained are calculated as the difference
between shares post offer and shares offered to the public. Information on shares post offer
come from the prospectuses and completed from: http://biz.yahoo.com/ipo and
http://moneycentral.hoovers.com .
Issuing firm age is calculated as Ln (1+age) and age is the difference between the founding
year and the issue year. Information on founding year comes from Jay Ritter website, a file
presenting founding years for firms from 1975 to 2008.
Information on expected net proceeds to measure the issue size, on ownership structure
(insiders’ ownership, institutional ownership, blockholders ownership) and on financial data
in the year prior to going public (assets, sales, net income, EBITDA) to measure the different
proxies of risk and on R&D expenditures come from the final prospectuses of issuing firms.
If a firm has zero sales, I assign a sales value of 1 thousand $, since in my empirical work I
use logarithms, and the logarithm of zero is undefined.
R&D intensity is calculated as the ratio of R&D expenditures (a year prior to offering) to the
expected market value. To calculate the expected market value of an IPO, I use the offer price
multiplied by the post-issue number of shares outstanding.
For sales and R&D expenditures, if I am not sure whether they are zero or are missing, I treat
the value as missing.
Unfortunately, missing values on R&D expenditures (underwriter reputation for 6 firms and
sales for 4 firms) reduce the sample to 117 observations. Trying to eliminate R&D intensity as
an explanatory variable to increase the number of observations has deteriorated the model, so
R&D intensity is a fundamental explanatory variable to underpricing phenomenon.
Information on Venture Capital backed comes from prospectuses.
Issue risk is a dummy variable taking the value of one if the issue is operating in a
technological risky sector and zero otherwise. I use the same method of Loughran and Ritter
(2004) to categorize IPOs as a technology firm or not.
Tech stocks are defined as those with SIC codes:
3571, 3572, 3575, 3576, 3577, 3578 (computer hardware)
3661, 3663, 3669 (communications equipment)
3671, 3672, 3674, 3675, 3677, 3678, 3679 (electronics)
3812 (navigation equipment)
3823, 3825, 3826, 3827, 3829 (measuring and controlling devices)
3841, 3845 (medical instruments)
4812, 4813 (telephone equipment)
4899 (communications services)
7370, 7371, 7372, 7373, 7374, 7375, 7378, and 7379 (software).
The two sentiment indicators used in this model: individual investor sentiment and
institutional investor sentiment are available on a weekly basis that are compiled from surveys
by the American Association of Individual Investors and Investors Intelligence.
If I want to look at the true relationship between underpricing and sentiment, for an IPO at the
week t, I should work with the sentiment indicator of the week t-1 because it more accurately
reflects the investor sentiment for the week t, but since there is a time lag of 1 week between
responses and reporting (as I presented earlier the procedure of reporting these indicators), I
should actually work with the sentiment of the same week t to overcome this reporting lag.
Time dummy: a dummy variable taking the value of 1 if the IPO date is after July 2007, and
zero otherwise. This variable is used to control the beginning of financial crisis period and its
impact on underpricing.
Table 2 provides descriptive statistics of the full sample: The overall mean
underpricing of the sample (117 observations) 29.54%, the overall mean for overhang ratio is
9.706, 0.022 for R&D intensity, the overall mean firm age of the sample is approximately 11
years (10 years and 10 months). The overall means of firm profitability and ROA are negative
and the overall mean of insiders’ ownership is 55.48%. The overall means of investors bullish
bearish ratios (individuals and institutionals) are higher than 1, which indicates that individual
and institutional investors in this period and for this sample are rather optimistic than
pessimistic.
Table 2. Descriptive Statistics of the Full Sample
The sample size is 217, R&D expenditures is missing for 90 firms, Underwriter ranking is missing for 6 firms and sales is missing for 4 firms, reducing the number of observations to 117. The dependent variable is the percentage first-day return from the offer price to the first-day closing price. The underwriter reputation dummy takes a value of one if the lead underwriter has an updated Carter and Manaster (1990) rank of 8 or more, and zero otherwise. Share overhang is the ratio of retained shares to the public float (the number of shares issued). R&D intensity is the ratio of Pre-IPO R&D expenditures to the expected market value.
The VC dummy takes a value of one (zero otherwise) if the IPO is backed by venture capital. Ln(1 + age) is the natural log of 1 plus the years since the firm’s founding date as of the IPO. The Ln(assets) is the natural logarithm of the pre-issue book value of assets expressed in millions $. Ln(sales) is the natural log of the firm sales a year prior the offering, expressed in millions $. Firm profitability is the ratio of Pre-IPO EBITDA to total assets value.
ROA is the ratio of Pre-IPO net income to total assets value. The issue risk is a tech dummy takes a value of one (zero otherwise) if the firm is in the technology business. Insiders’ ownership and blockholders’ ownership are proxies to ownership structure and issuer bargaining power. AAII and II bullish bearish Ratios are the % of bullish investors divided by the % of bearish investors. Time dummy takes a value of one (zero otherwise) if the IPO occurred after July 2007.
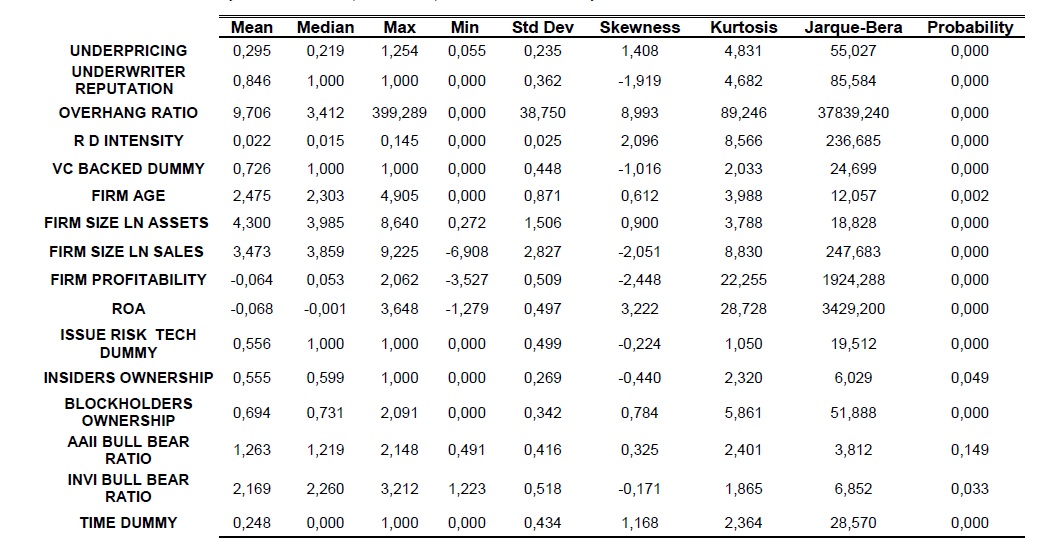
From the Jarque-Bera test, we can deduce that the dependant variable and all the explanatory
variables are not normally distributed except for individual investors sentiment (p.value =
0.1486).
I classified the sample into two subsamples: firms with low underpricing (≤sample median
21.85% (59 obs)) and firms with high underpricing (>sample median (58 obs)). (Descriptive
statistics of the two subsamples are in tables 3 and 4)
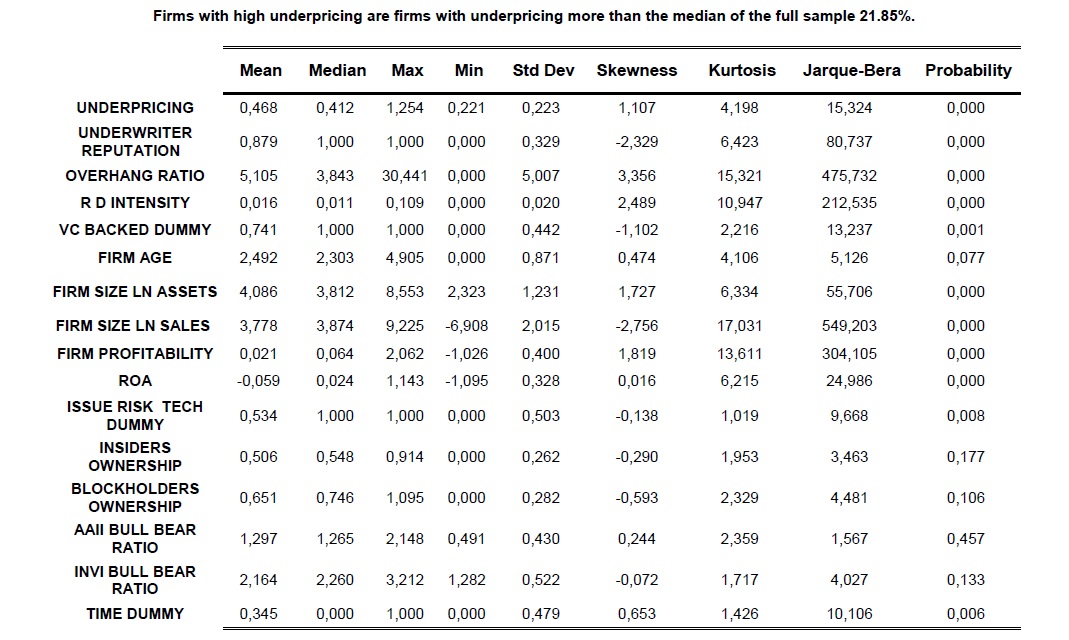
For firms with high underpricing, I notice that the means of overhang ratio, R&D intensity
and insiders’ ownership are lower than those of low underpricing, but the mean of AAII
bullish bearish ratio is higher: these remarks indicate that underpricing increases
monotonically with higher individual investors’ sentiment and decreases with higher firm
quality and higher issuer bargaining power.
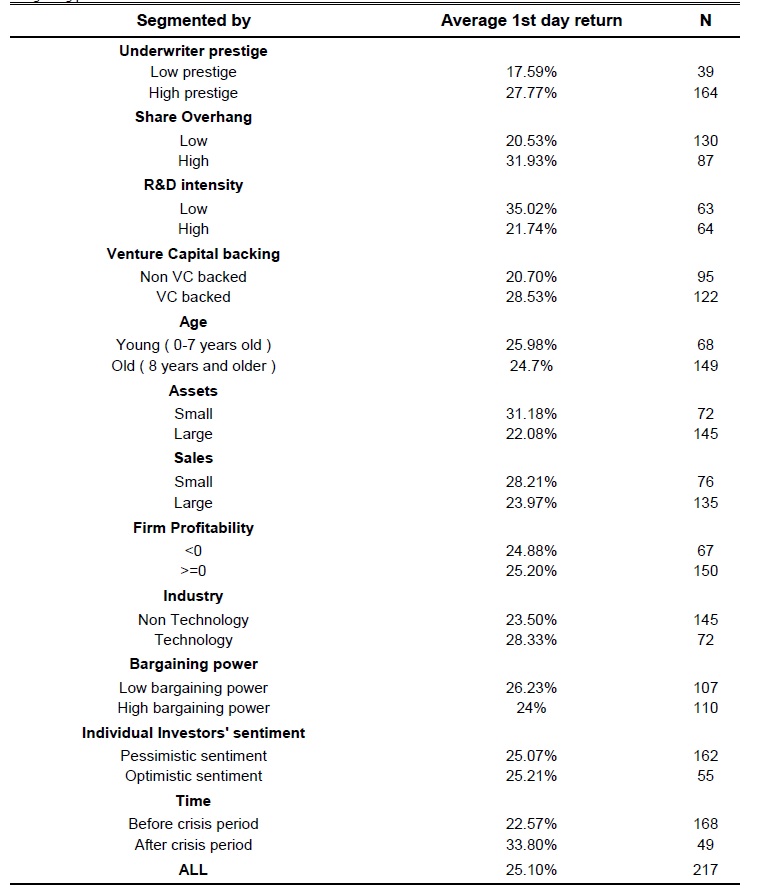
Table 5 indicates that firms with highest underpricing at the 1st day of trading are almost risky
firms (young firms with small assets and sales and operating in a technological sector). From
the underwriter prestige segmentation, I remark that almost firms look for hiring prestigious
underwriters and these firms have the highest underpricing degree. Higher issuer bargaining
power leads to lower underpricing.
Table 3. Descriptive Statistics of Firms with Low Underpricing
Firms with low underpricing are firms with underpricing less than the median of the full sample 21.85%.
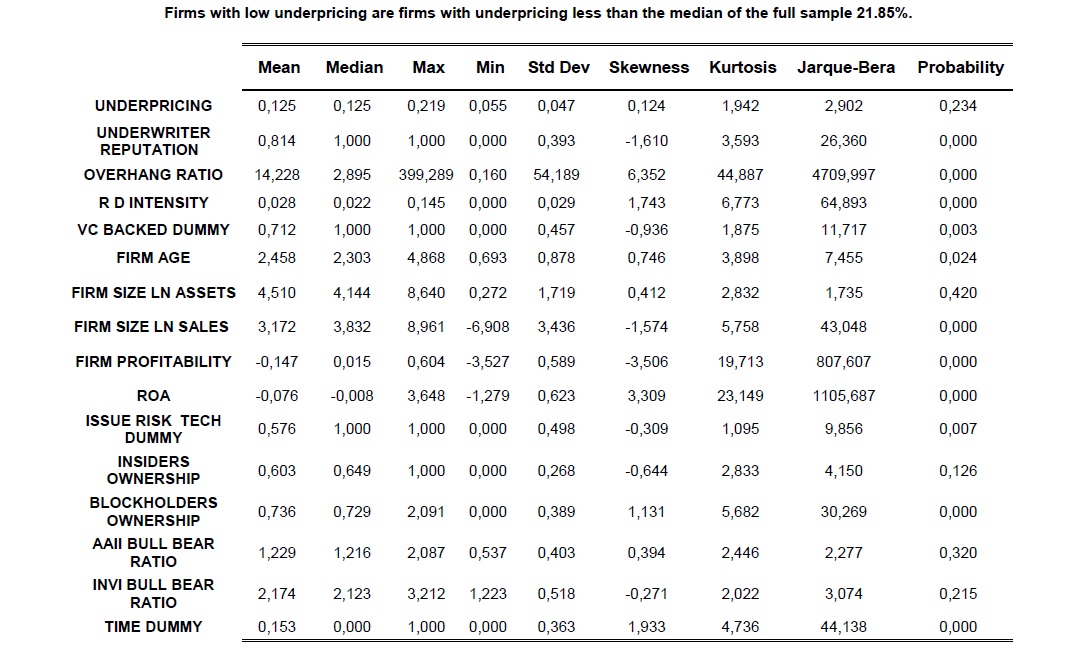
Table 4. Descriptive Statistics of Firms with High Underpricing
Firms with high underpricing are firms with underpricing more than the median of the full sample 21.85%.
Table 5. Average First-day Returns Categorized by Underwriter
prestige, Share Overhang, R&D Intensity, VC Backing, Age, Assets,
Sales, Firm profitability, Industry, Bargaining Power, Individual
Investors’ sentiment and Time
Data are from iposcoop, Securities and Exchange Commissions data and other sources; the sample size is 217, R&D expenditures is
missing for 90 firms, Underwriter ranking is missing for 6 firms and sales is missing for 4 firms. High prestige underwriters are those
with a ranking of 8 or higher on 0-9 scale. Low share overhang IPOs have an overhang ratio of 3.412 (median) or lower. Firms with
low R&D intensity are those with R&D intensity lower than 1.5% (median). Firms with 0-7 years old are classified as young. Firms
with 12 months pre-IPO assets less than $53.8 million are classified as small. Firms with 12 months pre-IPO sales less than $47.4
million are classified as low sales firms. Firms with insiders’ ownership less than 59.88% (median) are classified as firms with low
bargaining power.
Retour au menu : Investor Sentiment and Short Run IPO Anomaly: A Behavioral Explanation of Underpricing
